
Using precise methods for counting the frequency of events in a data stream becomes infeasible with large volumes. Precise counting methods at scale often require a significant amount of memory to maintain exact counts over a large data set.
In contrast, Count-Min Sketch (CMS) offers a probabilistic solution that provides approximate frequency counts using significantly less memory, making it ideal for real-time processing of large-scale data streams where exact accuracy can be traded for efficiency and performance.
The Use Case
Count-Min Sketch is best utilised when the count or frequency of data items is needed for a large dataset but where it is also acceptable for this count to be an estimated value.
For example, a Count-Min Sketch could monitor network traffic and track the frequency of requests per IP address to prevent a denial of service attack from clients attempting to overwhelm a service. In this context, an estimate will be more than sufficient for spotting problematic clients on a network.
Count-Min Sketch trades off a small degree of accuracy in exchange for providing a highly performant mechanism for approximating counts. This performant nature can be useful for processing large datasets such as network traffic. Additionally, it can also be useful in highly distributed systems where multiple nodes may need to track the frequency of events without excessive communication or processing overhead. For example, a Content Delivery Network (CDN) with many nodes can use CMS to efficiently identify and track frequently requested resources to assist with cache optimisation.
What is Count-Min Sketch?
Count-Min Sketch is a space-efficient probabilistic data structure that allows us to count the number of times an item appears in a data stream.
Count-Min Sketch is probabilistic because it estimates the number of times an item has appeared in the data stream. As a result, Count-Min Sketch can sometimes return an overestimate, but it is impossible for CMS to return an underestimate.
Probabilistic or statistical data models are often assessed in terms of:
- True Positive (TP) – a true positive is where a model accurately predicts that something happened (e.g. returns an accurate count for the number of times the item has occurred)
- False Positive (FP) – a false positive is where a model predicts that something happened when it didn't (e.g. returns an overestimate for the number of times the item has occurred)
- True Negative (TN) – a true negative is when a model accurately predicts that something did not happen (e.g. returns a count of 0 for an item that did not occur)
- False Negative (FN) – a false negative is when a model predicts that something didn't happen when it did (e.g. returns an underestimate for the number of times the time has occurred)
| Predicted Negative | Predicted Positive | |
|---|---|---|
| Actual Negative |
True Negative (TN) Returns a count of 0 for an item that did not occur Probability: 100% |
False Positive (FP) Returns an overestimate for the number of times the item has occurred Probability: >0% |
| Actual Positive |
False Negative (TN) Returns an underestimate for the number of times the time has occurred Probability: 0% |
True Positive (TP) Returns an accurate count for the number of times the item has occurred Probability: <100% |
In summary, it is not possible for CMS to underestimate how many times an item occurs, but because the "count" a false negative is not possible; therefore it will either be accurate or an overestimate.
How Does Count-Min Sketch Work?
A Count-Min Sketch is similar in principle to a counting bloom filter. With Count-Min Sketch, we have a two-dimensional array of counters that are incremented to track if an item has been seen.
Similar to a bloom filter we have a set of hash functions – h0…hk – which are used to determine the locations to updated in our two-dimensional array of counters when we need to increment the count or check the value for a given item.
Like with a bloom filter, the size of our two-dimensional array is partially determined by the accuracy we want. In crude terms, the larger the array, the lower the false positive rate. Equally, our Count-Min Sketch array is a finite size, which means any hashing outputs will need to be constrained to the width (w) of the array using modular arithmetic.
In the following simplified example, the two-dimension counter array would look be initialised as follows:
| Index | 0 | 1 | 2 | 3 | 4 | 5 | 6 | 7 | 8 | 9 |
|---|---|---|---|---|---|---|---|---|---|---|
| h0 | 0 | 0 | 0 | 0 | 0 | 0 | 0 | 0 | 0 | 0 |
| h1 | 0 | 0 | 0 | 0 | 0 | 0 | 0 | 0 | 0 | 0 |
Let us now imagine a scenario where we are going to count the number of times that we see different colours.
If we want to count that we have seen the element "red", we can run this through our hashing functions to determine the indexes for us to check.
h0("red") (mod w) = 2
h1("red") (mod w) = 5
We can now increment the counts at these indexes.
| Index | 0 | 1 | 2 | 3 | 4 | 5 | 6 | 7 | 8 | 9 |
|---|---|---|---|---|---|---|---|---|---|---|
| h0 | 0 | 0 | 1 | 0 | 0 | 0 | 0 | 0 | 0 | 0 |
| h1 | 0 | 0 | 0 | 0 | 0 | 1 | 0 | 0 | 0 | 0 |
If we were to consider another element, "blue":
h0("blue") (mod w) = 4
h1("blue") (mod w) = 9
Indexes 4 and 9 can now be incremented to count blue:
| Index | 0 | 1 | 2 | 3 | 4 | 5 | 6 | 7 | 8 | 9 |
|---|---|---|---|---|---|---|---|---|---|---|
| h0 | 0 | 0 | 1 | 0 | 1 | 0 | 0 | 0 | 0 | 0 |
| h1 | 0 | 0 | 0 | 0 | 0 | 1 | 0 | 0 | 0 | 1 |
Now, we'll consider another element, "yellow":
h0("yellow") (mod w) = 2
h1("yellow") (mod w) = 7
In this example, index 2 in h0 already has a count of 1 that will need to be incremented to 2, and index 7 for h1 can be incremented from 0 to 1:
| Index | 0 | 1 | 2 | 3 | 4 | 5 | 6 | 7 | 8 | 9 |
|---|---|---|---|---|---|---|---|---|---|---|
| h0 | 0 | 0 | 2 | 0 | 1 | 0 | 0 | 0 | 0 | 0 |
| h1 | 0 | 0 | 0 | 0 | 0 | 1 | 0 | 1 | 0 | 1 |
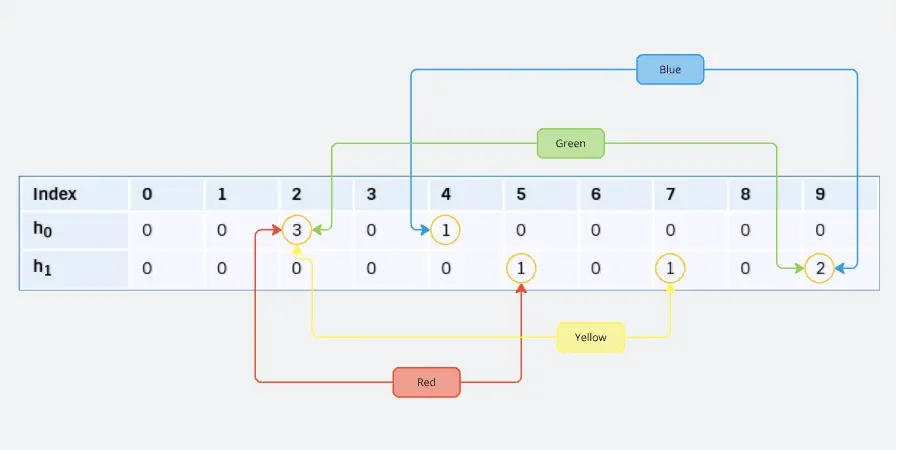
Finally, let's consider another element, "green", where both counters have already been set:
h0("green") (mod w) = 2
h1("green") (mod w) = 9
| Index | 0 | 1 | 2 | 3 | 4 | 5 | 6 | 7 | 8 | 9 |
|---|---|---|---|---|---|---|---|---|---|---|
| h0 | 0 | 0 | 3 | 0 | 1 | 0 | 0 | 0 | 0 | 0 |
| h1 | 0 | 0 | 0 | 0 | 0 | 1 | 0 | 1 | 0 | 2 |
The process of incrementing counts, based on the outputs of the hash functions, is fairly straightforward, but how do we determine the count for a given element?
We must take the minimum count at all hash locations to calculate the count for a given element.
| Element | Calculation | Estimation | Classification |
|---|---|---|---|
| Red |
min( count[0][h0("red")], count[0][h1("red")] ) |
min( 2, 2 ) = 2 |
False-Positive (Over estimate, actual is 1) |
| Blue |
min( count[0][h0("blue")], count[0][h1("blue")] ) |
min( 2, 1 ) = 1 |
True-Positive (Accurate Count) |
| Yellow |
min( count[0][h0("yellow")], count[0][h1("yellow")] ) |
min( 2, 1 ) = 1 |
True-Positive (Accurate Count) |
| Green |
min( count[0][h0("green")], count[0][h1("green")] ) |
min( 3, 2 ) = 2 |
False-Positive (Over estimate, actual is 1) |
The summary table above demonstrates that we will either end up with an accurate count where there are no hash collisions; alternatively, if there is a collision, this will result in an overestimate.
Because the process of counting an element involves incrementing values at each location determined by the hash functions, and the process of retrieving the count involves taking the minimum of these values, it is therefore impossible for Count-Min Sketch to return an underestimate (a.k.a false positive).
Couldn't we just use a database?
If we wanted to track the exact count of elements accurately, one solution that we may arrive at is using a well-indexed database table to track the count of elements.
This approach will work to a point, but at significant scale and with substantial data volumes, this approach will have a reduced performance when compared to Count-Min Sketch – albeit CMS will only be able to provide an estimate and not an actual count.
| Approach | Count-Min Sketch | Indexed Databases |
|---|---|---|
| Insertion Complexity |
O(k) Constant Time, where k is the number of hash functions. |
O(log n) Sublinear, but slower than constant time, due to indexing. |
| Query Complexity |
O(k) Constant Time, where k is the number of hash functions. |
O(log n) Sublinear, but slower than constant time, due to indexing. |
| Relative Space Efficiency |
Lower Due to approximate counters. |
Higher Due to the storage of all records and associated indexes, |
| Accuracy | Approximate with overestimation. | Exact counts. |
Conclusion
Count-Min Sketch can be a space-efficient and performant solution for estimating the counts of elements in a dataset under the correct conditions. Count-Min Sketch is best suited to situations where:
- The dataset is considerably large, and there are many unique instances
- An approximated count is considered acceptable, and any overestimation will not cause a material issue
If, however, exact counts are critical or your dataset is small a probabilistic data structure such as Count-Min Sketch won't provide you with the correct trade-off.
