
Have you ever had an application misbehave in production, and you've had to trawl through the logs to try and make sense of what's happened? Yep, we've all been there, and in some cases, it can be a real mission to figure out what has happened. And in the most extreme examples, what logging exists can add little to no value.
So what does good logging look like? In short, good logging needs to tell a story of what's happening in the system. It needs to include context and information about the actions and state of the system – not too much that its overwhelming and not too little that you don't know what's going on. Good logging practices can drastically reduce the amount of time needed to diagnose problems in an application.
In principle, this is all fairly straightforward, but there are numerous decisions and considerations that need to be made to get to the point of having good logging. In the remainder of this post, I'll dig into the detail of how to approach having useful and meaningful logging.
Use a Logging Framework
Always make sure to use a logging framework. From time to time, I still encounter codebases where developers have opted to use print statements or to roll their own logging code.
There is no point in re-inventing the wheel. Use a logging framework – unsurprisingly, they're typically more efficient and better designed for the purpose.
A good logging framework out of the box will support:
- Logging to different targets or handlers (stdout, files, plain text, JSON, etc.)
- Log levels
- Categorising log messages
- Attaching contextual information to log messages (e.g. thread identifiers, correlation IDs, etc.)
- Lazy evaluation of objects – if the log level is too high for the target, the framework won't attempt to evaluate the string representation of an object that's been included in the log message.
- Custom formatting – you'll be able to customise the formatting of log messages to suit your preference.
Write Human and Machine Readable Logs
Logs need to be digestible by humans and machines. Whilst these two target audiences have slightly different needs; they share a lot in common. The log messages themselves need to be useful and contain the right information to facilitate troubleshooting.
We've all seen log messages that look like this:
2022-07-23 11:29:02 [INFO] waitOrder()
2022-07-23 11:29:03 [INFO] request of type 'D' for '274'
What does this actually mean?
We could figure it out, but we'd have to go back to the code to understand the context – this is far from ideal.
Logs should be readable without access to the code
Without having the code open in front of you, it should be possible to read the logs and roughly understand what is happening or what part of the application is getting into difficulty.
This is how the above example could convey more context:
2022-07-23 11:29:02 [INFO] Order queue is empty - no pending orders to process.
2022-07-23 11:29:03 [INFO] New order (id=274) received of type 'D'.
By including more context, we can understand that we're looking at log messages related to order processing. Before, we had cryptic log messages where we would have needed to see the code to have understood the true meaning behind the messages or what the parameters in the log message relate to.
There is a trade-off here. Too much information will take more time to analyse, consume more disk space, impact performance, etc. but having a broad outline of what is happening allows us to assess the logs with some degree of independence from the code.
Include contextual information
Understanding the events that have occurred is essential to leveraging logs to troubleshoot an application. An event is typically a combination of an action and some data/state.
Without context, our logs will look like this:
2022-07-23 11:29:02 [INFO] New basket created
2022-07-23 11:29:02 [INFO] Product added to basket
2022-07-23 11:31:31 [ERROR] Payment failed
With context, our logs could look like this:
2022-07-23 11:29:02 [INFO] New basket {id=ec8e007c} created
2022-07-23 11:29:02 [INFO] Product {id=4e2558b8} added to basket {id=ec8e007c}
2022-07-23 11:31:31 [ERROR] Payment failed for basket {id=ec8e007c} - connection refused by paymentgateway.example.com
Where possible, aim to provide unique identifiers in logs as this will allow logs to be correlated with application data and state. Avoid logging sensitive information (passwords, credit card details, etc.) or personally identifiable information (PII).
Agree and Standardise on Log Levels
Most logging frameworks will support a series of log levels such as DEBUG, INFO, WARN, and ERROR. As you would probably expect, WARN and ERROR logs can be used to quickly spot issues or potential issues happening within an application's logs. INFO and DEBUG level logging are more typically used to convey general information.
Having different log levels allows for logs to be better filtered. For example:
- In a production environment, logging out
DEBUGlevel logging offen results in too verbose logs. SoDEBUGlogs are often supressed in production environments. - It may be helpful to direct logs by log level to different targets. If log levels are used correctly, you could, for example, choose to log
INFOandDEBUGlogs to one file andWARNorERRORlogs to another. - Monitoring tools can also be put in place to alert when
ERRORorWARNlog messages occur in logs so that these can be investigated
As a development team, it's important to agree on a set of criteria for each log level so that logging can be implemented consistently across the team.
Here is an example set of criteria for ERROR, WARN, INFO and DEBUG log levels:
ERROR
Something happened that caused a problem for the system/user. The event that caused the error warrants an investigation (e.g. the application could not connect to the database).
WARN
Something unexpected or potentially problematic occurred, but there was no consequential impact on the system/user. However, intervention or an investigation may be necessary to prevent further occurrences. (e.g. a call to an external API failed due to a transitive network issue but was successful on the second attempt).
For either ERROR or WARN, avoid using these for legitimate "sad paths" that are considered business-as-usual. For instance, I have seen ERROR and WARN log levels used when a request from a user legitimately fails validation (for example). The instinctive reaction can be to use ERROR or WARN because something negative happened. However, this is normal behaviour that does require a developer to intervene, something like this would be more appropriate at an INFO or DEBUG level depending on the specific circumstances.
INFO
As the name suggests, this log level is best suited for general information about the system. Actions and events that occur within a system as part of business-as-usual operations should be logged at an INFO level.
DEBUG
Debug level logging is helpful for providing more detail beyond the general actions or events that are happening.
This is an example of INFO and DEBUG log levels being split appropriately:
2022-07-23 11:29:02 [INFO] New basket {id=ec8e007c} created
2022-07-23 11:29:02 [INFO] Product {id=4e2558b8} added to basket {id=ec8e007c}
2022-07-23 11:31:31 [DEBUG] Shipping requires next-day courier {shipping=3.99}
2022-07-23 11:31:31 [DEBUG] Shipping weight of 8.5kg, add Band1 shipping fee of 2.00 {shipping=5.99}
2022-07-23 11:31:31 [INFO] Finalising basket amounts {products=31.99, shipping=5.99,toal=37.98}
In the above example, the detailed decision logic of determining the shipping fee value is being logged at a DEBUG level. Under normal operation, this level of detail could be considered too verbose for a production environment where DEBUG is typically suppressed. However, having DEBUG logging in an application can be helpful for investigating issues in production – the log level can be increased without the need to add new logging or produce a new build because logging wasn't sufficient to begin with.
Correlating Logs
A single log statement on there own usually isn't that useful. However, understanding which log statements relate to a given request or thread of execution is essential for understanding any system, especially systems that deal with concurrent operations.
Most logging frameworks provide a way to associate an additional context with a log message that avoids adding the context manually to each log statement. Exactly how this works for the logging framework you use will vary from framework to framework. Popular Java logging frameworks such as Log4j and Logback have Mapped Diagnostic Context (MDC) specifically for this purpose. On the other hand with something like .NET there are a number of ways this could be achieved, either through a custom ILogger implementation or by using something like the BeginScope logger extension.
Correlation IDs
A Correlation ID is a generated unique ID that is used to correlate log statements together.
Let's look at a typical web server that processes a web request. When the request is received the server generates a Correlation ID (e.g. e31e8ebe), this ID is used to tie together all log statements that are produced in the fulfilment of that request:
2022-07-23 11:29:02 [INFO] [8e2ecdf3] New basket {id=ec8e007c} created
2022-07-23 11:29:02 [INFO] [8e2ecdf3] Product {id=4e2558b8} added to basket {id=ec8e007c}
2022-07-23 11:31:31 [INFO] [8e2ecdf3] Finalising basket amounts {products=31.99, shipping=5.99,toal=37.98}
Let's look at a typical web server that processes a web request. When the server receives a request, the server generates a Correlation ID (e.g. e31e8ebe). This ID is used to tie together all log statements that are produced in the fulfilment of that specific request. This allows us to differentiate the logs from one request from the logs of any other:
2022-07-23 11:29:02 [INFO] [494544e9] New basket {id=d9a94283} created
2022-07-23 11:29:02 [INFO] [8e2ecdf3] New basket {id=ec8e007c} created
2022-07-23 11:29:02 [INFO] [8e2ecdf3] Product {id=4e2558b8} added to basket {id=ec8e007c}
2022-07-23 11:29:02 [INFO] [494544e9] Product {id=2c6735f4} added to basket {id=d9a94283}
2022-07-23 11:31:31 [ERROR] [494544e9] Payment failed for basket {id=d9a94283} - connection refused by paymentgateway.example.com
2022-07-23 11:31:31 [INFO] [8e2ecdf3] Finalising basket amounts {products=31.99, shipping=5.99,toal=37.98}
Here we have two reequests running in parallel, one with the ID 494544e9 and the other with an ID of 8e2ecdf3.
Fish Tagging
Fish tagging is a concept that builds on Correlation IDs and allows related activity to be tracked between systems.
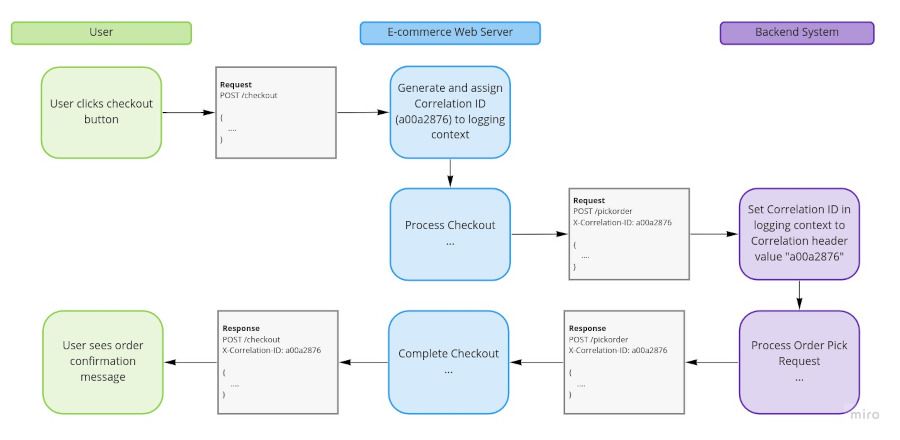
Let us assume we have a web server that handles sales from an e-commerce store, and there is a separate backend system used for fulfilling orders. When an order is placed on the store, the store needs to make API requests to the backend system.
The e-commerce web server generates Correlation IDs for all requests that come into the system. That way, all log statements generated by a single request can be grouped together using their Correlation ID. This works well for a single application, but what if we wanted to track related activity in the backend system?
The store web server could use fish tagging. When the e-commerce web server calls out to the backend system, the Correlation ID generated by the e-commerce web server is passed to the backend system along with the request. The backend system will then use the provided Correlation ID as the Correlation ID for that request. As a result, both systems will use the same Correlation ID, which means we can correlate log statements between systems.
This technique works with API calls, event messages, and any other form of communication between systems.
Logging Data
So far, we have focused predominantly on making logs readable for humans. Another aspect of this is making logs readable for machines for cases where logs may be ingested and processed by something like an ELK stack. In this case, structured data can be much more preferable. Sometimes logs need to provide data beyond basic key/value pairs to the developer.
In this scenario there are two options:
- Include a data payload in the log statement
- Log out a data payload to a separate target.
Data Payloads in Log Statements
In the next section, we'll look more closely at logging formats, but if a data payload would be a helpful addition to a log line, it's worth considering adding a data payload in a format such as JSON to the end of a log line:
2022-07-23 11:29:02 [INFO] [8e2ecdf3] [web-1 ] Product {id=4e2558b8} added to basket {id=ec8e007c}. Product details: {"id": "4e2558b8", "name": "iPad Case", amount: 31.99}Data Payload to a Separate Target
Alternatively, your logging framework may support logging out directly to a JSON formatter or similar.
This will allow you to produce log files that can easily be consumed by tooling, such as ELK stack, as ELK (with some configuration) will be able to parse out the structured data in the JSON payload.
Log Formats
Using a sensible and predictable format for log statements makes scanning through and reviewing logs easier.
A sensible log format typically has the following properties:
- The timestamp and log level as the first two items in the log statement
- Fixed length parameters such as timestamp, log level, thread name, correlation ID, etc., appear at the beginning of the log statement.
- Any data payloads (such as JSON data) appear after the fixed length parameters and log message.
2022-07-23 11:29:02 [INFO] [8e2ecdf3] [web-1   ] New basket {id=ec8e007c} created
2022-07-23 11:29:02 [INFO] [8e2ecdf3] [web-1   ] Product {id=4e2558b8} added to basket {id=ec8e007c}. Product details: {"id": "4e2558b8", "name": "iPad Case", amount: 31.99}
2022-07-23 11:31:31 [INFO] [8e2ecdf3] [web-3   ] Finalising basket amounts {products=31.99, shipping=5.99,toal=37.98}
2022-07-23 11:31:31 [INFO] [8e2ecdf3] [mailer-1] Sending order confirmation email for basket  {id=ec8e007c}
In the above example our log statements are formatted as follows:
- Timestamp
- Log Level
- Correlation ID
- Thread Name
- Log message
- Data Payload (optional JSON) – one of the log lines includes a data payload at the end
Exception Handling
Exceptions are typically a negative thing. Therefore the usual instinct is to log an ERROR when an exception occurs. However, if the exception is expected or anticipated, it doesn't make sense to log this as an ERROR.
If the exception is unexpected or results in a degraded experience, then the exception should be logged as an ERROR along with the appropriate context. In these cases, the stack trace should be included in the log statement to provide sufficient contextual information.
Actionable Errors and Warnings
Where possible, error and warning log messages should include any details of corrective actions that can be followed. This can be helpful in understanding how to get a system back to a working state.
2022-07-23 11:31:31 [ERROR] [31e158eb] [scheduler] Schedule billing task failed - connection refused for paymentgateway.example.com. Re-run manually using 'rake billing:generate'Summary
How easy an application is to support in production can be influenced by the quality of the diagnostic logging and how easy it is to troubleshoot issues and problems.
A well-thought-out and consistent approach to logging can drastically impact how easy it is to troubleshoot and resolve issues, as well as lowering the barrier for less-familiar developers to delve into an area of the codebase that they're less familiar with.
As a team, agree on how you want to use log levels and the level of contextual information that you wish to include by default.
Always use an established logging framework. When picking a logging framework, ensure you understand:
- How to customise the formatting of logs
- How to log to different targets/handlers
- How to output in different formats
- How the attach additional contextual information such as Correlation IDs.
